September 18, 2026
Learn how to calculate your Chinese restaurant profit margin, compare U.S. benchmarks, control major costs, and improve profitability with practical steps.

High sales can still leave little profit when food, labor, rent, delivery fees, and other operating costs consume most of the revenue. Your Chinese restaurant profit margin shows what percentage of sales remains after expenses and where rising costs may be reducing earnings.
This guide covers typical U.S. benchmarks, the difference between gross and net profit margin, the formulas used to calculate each one, and practical ways to improve performance. You will also see how restaurant format, sales channels, and local costs can affect your results.
A typical U.S. restaurant operates on a low-single-digit profit margin. In 2024, median pre-tax income equaled 2.8% of sales for full-service restaurants and 4.0% for limited-service restaurants. Since no reliable national figure covers Chinese restaurants separately, compare your results with businesses that follow a similar service model.
A typical Chinese restaurant profit margin is generally in the low single digits. The most recent detailed benchmark from the National Restaurant Association reported median pre-tax income of 2.8% of sales for full-service restaurants and 4.0% for limited-service restaurants in 2024.
The Association published the data in 2025 using financial and operating results from more than 900 U.S. restaurants. These figures represent the broader restaurant industry rather than a Chinese restaurant-specific average, and they measure pre-tax income rather than after-tax net profit.
More recent research shows that cost pressure remained high after the benchmark period. According to the National Restaurant Association, 42% of restaurant operators reported that their businesses were not profitable in 2025. The Association also estimates that total expenses for an average restaurant rose 36% between 2019 and 2026, driven by increases in food, labor, occupancy, utilities, supplies, and payment-processing costs.
Public research does not report a reliable average net profit margin for Chinese restaurants in the U.S. as a separate category. A practical comparison starts with restaurants that follow a similar service model and calculate profit using the same accounting basis.
A full-service Chinese restaurant may align more closely with the 2.8% full-service benchmark, while a takeout-focused operation may compare better with the 4.0% limited-service benchmark. Restaurant size, local wages, rent, customer traffic, menu pricing, sales volume, and delivery-channel mix can move the final percentage higher or lower.
Although the detailed benchmark reflects 2024 performance, it remains useful alongside the Association’s more recent research on restaurant cost pressure. Use it as a comparison point rather than a fixed target.
Gross profit is the sales revenue left after subtracting direct food and beverage costs. It shows how well your menu prices cover ingredients and how closely the kitchen follows recipe portions.
For reference, food and nonalcoholic beverage costs represented a median of 32.0% of sales at full-service restaurants and 32.4% at limited-service restaurants in 2024.
Gross profit excludes payroll, rent, utilities, insurance, delivery commissions, marketing, and other operating expenses. A strong gross margin can still produce a weak bottom line when those costs run high.
Net profit is the revenue left after subtracting all recorded business expenses. This percentage gives you the clearest view of overall financial performance, but the result depends on which expenses your financial reports include.
Review gross profit margin and net profit margin each month. Gross margin shows how effectively menu sales cover direct food and beverage costs. Net margin shows how much revenue remains after the restaurant subtracts all recorded expenses.
Using both percentages helps you identify where financial performance changed. If gross margin declines, review ingredient prices, recipe portions, waste, discounts, and menu pricing. If gross margin stays stable while net margin falls, examine labor, occupancy, delivery fees, utilities, and other overhead.
Use the following formula:
Gross profit margin = (Net sales revenue − Cost of goods sold) ÷ Net sales revenue × 100
Net sales revenue includes restaurant sales after refunds, discounts, returns, and allowances. Keep sales taxes collected from customers and remitted to state or local governments separate where the tax is imposed on the buyer.
Cost of goods sold, commonly called COGS, includes the food and beverages used to produce sales. This can include meat, seafood, vegetables, rice, noodles, cooking oil, sauces, tea, garnishes, and other direct product costs.
Some restaurants classify takeout packaging as COGS, while others record it as an operating supply. Either method can work as long as you apply the same accounting treatment each month.
Assume your monthly figures show:
First, calculate gross profit:
$100,000 - $32,000 = $68,000
Then calculate gross profit margin:
$68,000 ÷ $100,000 × 100 = 68%
A 68% gross margin means food and beverage costs consumed 32% of sales. The remaining 68 cents from each sales dollar must cover labor, rent, delivery expenses, utilities, insurance, marketing, and other operating costs.
Track this percentage over time. If gross margin falls from 68% to 65% on $100,000 in monthly sales, gross profit decreases by $3,000. Review supplier invoices, recipe costs, inventory records, portion sizes, waste, discounts, and complimentary items to identify the cause.
Use the following formula:
Net profit margin = Net profit ÷ Net sales revenue × 100
Net profit is the amount left after subtracting all recorded expenses from net sales revenue. These expenses generally include food, labor, payroll-related costs, rent, delivery fees, packaging, utilities, insurance, processing fees, marketing, software, repairs, and professional services.
Assume your monthly profit-and-loss statement shows:
For this example, the $17,500 includes all remaining expenses required to calculate net profit, including interest, income taxes, and depreciation where applicable. After these expenses, the restaurant retains $4,000 in net profit.
Calculate the margin:
$4,000 ÷ $100,000 × 100 = 4%
A 4% net profit margin means the restaurant keeps $4 from every $100 in sales after paying the listed expenses.
Compare this result with the gross margin. In this example, the restaurant generated a 68% gross margin but retained 4% as net profit. Labor, occupancy, delivery, utilities, and all remaining expenses consumed the remaining 64 percentage points.
Use consistent definitions across every reporting period. Confirm with your accountant how owner compensation, owner draws or distributions, income taxes, loan interest, and depreciation appear in your financial reports. Comparing a pre-tax margin with an after-tax margin can produce an inaccurate conclusion.
Review each monthly result against:
The trailing 12-month figure combines the latest 12 months of financial results. It reduces the effect of holiday sales, seasonal traffic, annual payments, equipment repairs, and temporary ingredient price increases.
A weak month may reflect a one-time expense. If both the monthly margin and trailing 12-month margin continue to decline, review the expense categories showing the largest increases as a percentage of sales.

A healthy sales total can still produce a thin margin when expenses climb. Review the following cost categories each month to see where revenue goes and which areas need attention.
Meat, seafood, cooking oil, rice, vegetables, sauces, noodles, and imported ingredients often account for a large share of monthly spending. Even a small increase in the cost of a high-volume item can reduce profit across hundreds of orders.
Compare supplier prices by unit, quality, usable yield, and delivery terms. Buying larger quantities may lower the price per case, but excess inventory can lead to spoilage and tied-up cash.
Portion control also affects food cost. Overfilled containers, oversized protein servings, preparation errors, and untracked waste add up quickly. Use standardized recipes, portion tools, and regular inventory counts to keep servings consistent.
Complimentary tea, sauces, chili oil, fortune cookies, utensils, and condiments also carry a cost. Set reasonable quantities based on order size and track frequent requests for extras.
Labor includes kitchen and front-of-house wages, overtime, payroll taxes, workers’ compensation, and employee benefits. Preparation-heavy dishes may also require extra hours for cutting, marinating, wrapping, and batch cooking.
Build schedules around sales by daypart and order channel. Compare scheduled hours with actual hours, review overtime each week, and adjust staffing when demand changes. Cross-training can also help cover busy periods and employee absences more efficiently.
Occupancy expenses may include base rent, common-area charges, landlord-passed property taxes, maintenance, waste removal, grease service, and pest control.
Compare total occupancy costs with monthly sales. A higher rent payment can remain manageable when the location generates strong traffic and order volume. During slower months, the same fixed expense can consume a much larger percentage of revenue.
Takeout and delivery sales carry costs beyond food. Third-party platforms may charge commissions, advertising fees, discounts, and refund-related expenses.
Packaging also affects each ticket. Containers, bags, utensils, sauce cups, labels, and tamper-evident seals can reduce contribution when quantities or materials exceed the order’s needs.
Track direct online orders, phone orders, walk-in takeout, and third-party delivery separately. This view helps you compare revenue with commissions, packaging, discounts, refunds, and order errors for each channel.
Utilities, ventilation maintenance, permits, insurance, credit-card processing, POS subscriptions, repairs, cleaning supplies, and marketing can take a sizable share of revenue when combined.
Review recurring expenses each quarter. Check software usage, processing statements, repair frequency, utility consumption, and campaign results. Small reductions across several categories can improve the final margin while preserving food quality and service.
Your restaurant format shapes how sales turn into profit. Takeout shops, full-service dining rooms, buffets, and fast-casual concepts each operate with a different mix of labor, occupancy, packaging, and food costs. Compare your results with restaurants that serve customers in a similar way so the benchmark reflects your operating model.
Takeout and delivery concepts often spend less on dining-room staff, furniture, and table service. Some of those savings shift to containers, bags, utensils, delivery commissions, digital promotions, and refunds.
Profit depends on steady order volume, accurate preparation, kitchen capacity, and the share of sales generated through direct ordering. Heavy dependence on third-party platforms can increase commissions and promotional costs.
Full-service concepts usually carry higher payroll and occupancy expenses due to servers, hosts, bussers, larger dining areas, tableware, and guest-service supplies.
They also have more opportunities to increase the average check through appetizers, beverages, desserts, premium seafood, and family-style meals. Monitor table turnover, party size, average check, and sales per labor hour to see how effectively the dining room generates revenue.
Buffets can serve many guests and generate strong sales volume, but food waste can rise quickly when demand changes by daypart. Large menus also require more preparation and frequent tray replenishment.
Track waste by dish, tray, and service period. Review batch sizes, refill timing, and premium-item usage to reduce leftovers while keeping the selection fresh and available.
Fast-casual restaurants often use counter service, focused menus, and standardized portions. These features can support quicker service, consistent production, and lower front-of-house labor needs.
Profit relies on reliable transaction volume, efficient kitchen stations, and menu items that share ingredients. Review sales by dish and daypart so purchasing and preparation stay aligned with demand.
Start with restaurants that share your service model. A takeout-focused operation should compare its net margin with other limited-service businesses, while a full-service location should use full-service data. This keeps the benchmark relevant to your cost structure.
Local conditions can shift the result. Wages, rent, utility rates, insurance, and ingredient prices vary by market, so adjust your expectations based on your location. Review each cost as a percentage of sales instead of comparing dollar amounts alone. Percentages show how efficiently your restaurant converts revenue into profit.
Account for sales-channel mix when comparing results, since dine-in, takeout, direct delivery, and third-party delivery carry different cost structures.
Compare monthly results with annual and trailing 12-month figures. Monthly reports help you spot changes quickly, while longer periods reduce the effect of holidays and seasonal demand.
If you operate several locations, review each one separately. Store-level benchmarks can reveal differences in labor, food cost, rent, and channel performance that a combined report may hide.
Use your sales and cost data to identify the areas with the greatest profit potential. Focus on a few measurable changes at a time, then review the results each month.
Calculate the food cost and contribution margin of each dish. Contribution margin is the selling price left after subtracting variable costs such as ingredients, packaging, and delivery fees.
Promote dishes that sell well and generate a healthy return. Reprice, resize, revise, or remove weak performers. Charge appropriately for extra protein, premium ingredients, substitutions, and larger portions.
Compare supplier prices, pack sizes, quality, and usable yield. Set purchasing limits based on recent sales, current inventory, ingredient shelf life, and expected demand.
Use standardized recipes and portion tools to keep food costs consistent. Track waste by ingredient and cause so you can improve ordering, storage, preparation, and portion control.
Build schedules from sales patterns by daypart and order channel. Compare scheduled hours with actual hours, and review overtime before payroll costs increase.
Cross-train employees where practical. Align preparation work with order volume so the kitchen stays ready during peak periods and limits excess production during slower hours.
Review each ordering channel by contribution rather than revenue alone. Include commissions, discounts, refunds, packaging, promotional fees, and added labor in the calculation.
Adjust third-party menu prices where agreements and local rules permit. Encourage repeat customers to order directly through your website, receipts, packaging inserts, and loyalty offers.
Create combinations and family meals with strong contribution margins. Train employees to suggest relevant appetizers, beverages, sides, desserts, and add-ons.
Place profitable dishes in prominent positions on printed and digital menus. Build promotions around contribution margin, order value, customer behavior, and slower periods instead of sales volume alone.
Record a baseline before adjusting prices, portions, purchasing, staffing, or promotions. Review the same metric after each change to measure its effect on food cost, labor percentage, average order value, channel contribution, and net profit.
Keep changes that produce consistent gains. Revise or stop changes that increase sales but reduce the amount retained from each order.
A healthy profit margin starts with consistent tracking. Review food costs, labor, occupancy, delivery expenses, and menu contribution each month. Compare the results with prior periods and relevant U.S. benchmarks. Small improvements in pricing, portion control, scheduling, and order-channel performance can produce meaningful gains over time.
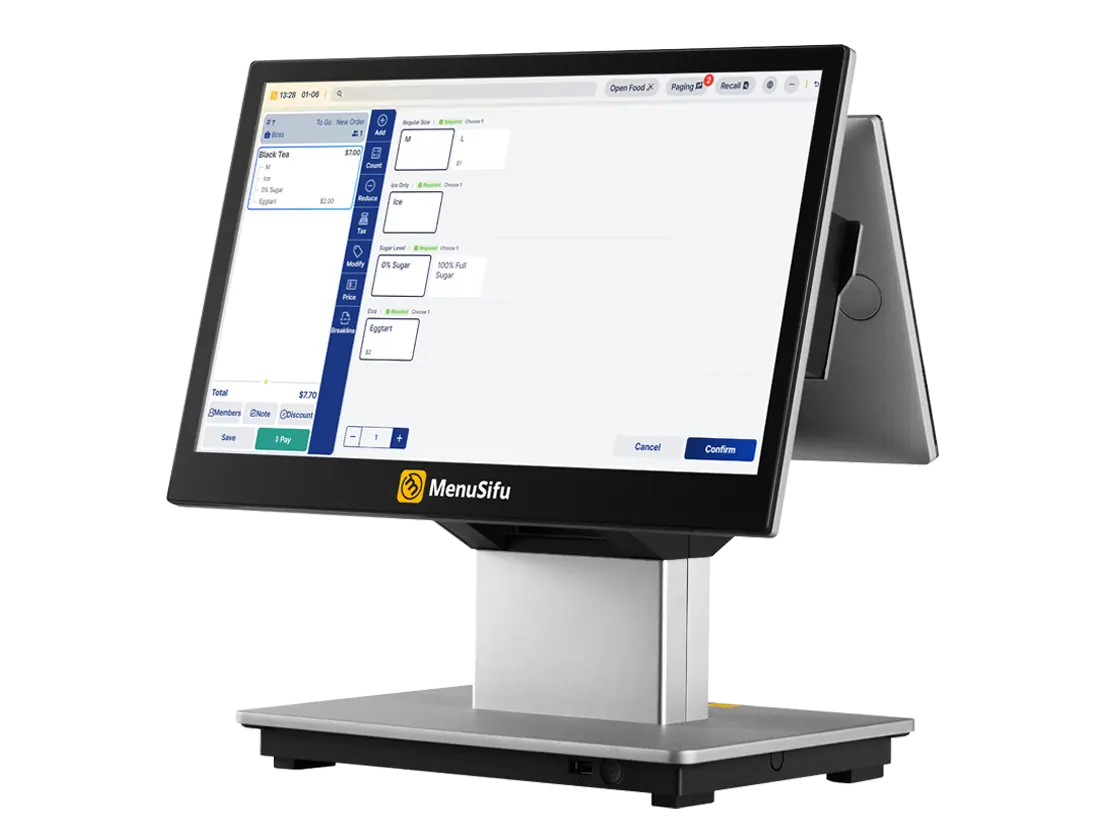
MenuSifu has supported Chinese restaurants across North America for more than a decade with POS technology built around their operating needs. The platform supports detailed menu modifiers, handheld ordering, bilingual QR and tablet menus, direct online ordering, delivery-platform integrations, all-you-can-eat controls, loyalty programs, and automated marketing tools. Consulting and financing services are also available to support future growth.
Clear sales and operational reporting can help you see where revenue increases, where costs reduce profit, and which changes produce better results. Book a Free Demo with MenuSifu today to explore how its Chinese restaurant POS system can support more informed financial and operational decisions.
The National Restaurant Association describes 3% to 5% as a typical profit-margin range for restaurants broadly. Its detailed 2024 data reported median pre-tax income of 2.8% for full-service restaurants and 4.0% for limited-service restaurants. Compare your result with businesses that follow a similar service model and accounting basis.
Public U.S. data does not report a separate national average for Chinese restaurants. A practical benchmark is a low-single-digit pre-tax margin: the National Restaurant Association reported median pre-tax income of 2.8% of sales for full-service restaurants and 4.0% for limited-service restaurants in 2024. Actual net profit varies based on service model, sales volume, location, labor, ingredient costs, rent, and delivery fees.
Calculate gross and net profit margins monthly. Review food and labor percentages weekly when reliable sales and cost data are available. Compare monthly results with the same period last year and a trailing 12-month average to identify seasonal and long-term trends.
Yes. High sales can still produce a low profit margin when food waste, overtime, delivery commissions, discounts, rent, and underpriced menu items consume too much revenue. Track food, labor, occupancy, and order-channel costs as percentages of sales to identify where profit declines.
Items with controlled portions, stable ingredient costs, consistent demand, and limited waste often generate stronger contribution margins. Beverages, appetizers, rice dishes, and noodle dishes may perform well in some restaurants, but results vary by recipe and operating model. Calculate each item using its selling price, ingredient cost, packaging, preparation requirements, and sales volume.
Both serve different purposes. Gross margin shows how efficiently menu prices cover food and beverage costs, while net margin shows how much profit remains after all operating expenses. Use gross margin to control food costs and net margin to evaluate overall profitability.
Visit the MenuSifu blog for additional articles on restaurant operations, technology, menu performance, delivery, and growth.
Related Articles: